The developer J-curve: fewer developers now, far more work later
Microsoft offered 60,000 people the door. Block cut 40%. The headlines say AI is coming for the developers. The data says the opposite is also happening at the same time — the world is writing more code than it ever has. Both are true, because this is a J-curve, and we are standing in the dip.
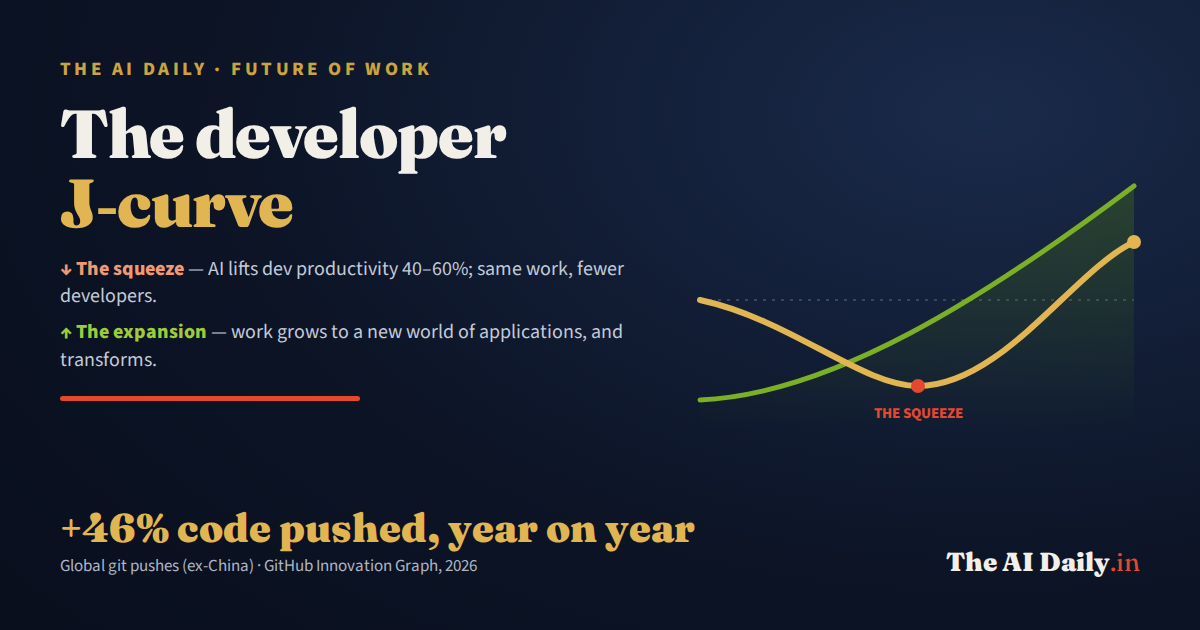
Fewer developers for the same work — so the total amount of work explodes, and changes shape. Our read of the GitHub Innovation Graph, against the major future-of-work research.
The layoff headlines and the growth data are not in conflict. For the same amount of work, AI now needs fewer developers — so in the short term the number needed dips. But the total amount of software work is exploding, and changing character — so the number needed bends back up. Fewer, then far more.
Why both things are true at once
- The squeeze is real. Microsoft offered ~60,000 staff voluntary exits; Block cut ~40% citing AI; Amazon’s CEO says AI will shrink its corporate workforce. Junior hiring is taking the hardest hit.
- Yet output is surging. On our read of the GitHub Innovation Graph, global git pushes rose 46% year on year — and pushes per developer climbed from 1.33 to 1.81. More people writing code, and each writing more.
- The work is changing shape. What endures and grows is the human-centred half: understanding what to build, designing things that work, and making AI output robust at scale.
What it means for leaders now
- Don’t read the cuts as the end state. They are the dip, not the destination — but the rebound is a bet on demand, not a guarantee.
- Protect the pipeline. The one clear casualty is the entry-level rung; the teams that keep training juniors will own the next wave of talent.
The story that defined late October 2026 was a paradox. On 26 October, Microsoft put a voluntary exit offer in front of about 60,000 employees — roughly a quarter of its workforce — even as it poured record sums into AI infrastructure. It was not framed as a layoff, and uptake is unknown. But it landed days after Block confirmed it had cut roughly 4,000 roles, about 40% of its people, with Jack Dorsey saying plainly that “intelligence tools have changed what it means to build and run a company.” Amazon, Meta and Salesforce are all trimming while capex hits records.
Read on their own, these look like proof that AI is eating software jobs. But we pulled the raw data on what the world’s developers are actually doing — and it points the other way. This piece reconciles the two. It is the sequel to our Demand Paradox, which argued the IT-services crash was the left arm of a J-curve. This is that J-curve, drawn for developers themselves.
1 · The squeeze is real — and it has a sharp edge
Start by taking the pain seriously. The cuts are not a rounding error, and they are explicitly tied to AI:
- Microsoft — a voluntary exit offer to ~60,000 staff (Oct 2026); an untested program, not yet a headcount number, running alongside heavy AI spend.
- Block — ~4,000 roles cut (~40%), explicitly AI-framed by Dorsey.
- Amazon — corporate cuts through 2025–26; CEO Andy Jassy: “we expect that this will reduce our total corporate workforce as we get efficiency gains from using AI extensively.”
- Salesforce — support headcount cut from ~9,000 to ~5,000 as Agentforce absorbs cases; engineering hiring held flat.
And the sharpest edge is at the bottom of the ladder. Stanford’s Digital Economy Lab found a 13% relative decline in employment for 22–25-year-olds in the most AI-exposed occupations since generative AI went mainstream. The first rung is where the squeeze bites hardest — the juniors whose work AI most cleanly substitutes.
2 · Yet the world is writing more code than ever
Here is the data almost no one is holding up next to the layoff headlines. GitHub’s Innovation Graph publishes quarterly developer and git-push counts by economy. We pulled it through 2026 Q1 and summed it, excluding China (whose developers largely live in a separate ecosystem, and whose data is unreliable).
The shape of the argument. For the same work, AI needs fewer developers — so the number needed dips (the squeeze, hardest on junior hiring). But total software work climbs, and the work changes character, pulling the number needed back up. Illustrative — the dip is evidenced; the timing and height of the rebound are the open question.
The totals are not subtle. Global git pushes went from 200M in Q4 2024 to 293M in Q4 2025 — up 46% year on year (a like-for-like, Q4-over-Q4 comparison, so not a seasonal quirk), and the latest quarter is running higher still. This is not a world doing less software. It is a world doing dramatically more.
And it is both more developers and more output per developer. Pushes per developer — a rough productivity proxy — rose from 1.33 to 1.81 across the same window. Every major economy shows the same twin rise:
| Economy | Developers | Git pushes | Pushes / developer | ||||||
|---|---|---|---|---|---|---|---|---|---|
| Q4’24 | Q4’25 | Q1’26 | Q4’24 | Q4’25 | Q1’26 | Q4’24 | Q4’25 | Q1’26 | |
| United States | 24.8M | 30.3M | 32.4M | 28.0M | 40.8M | 57.2M | 1.13 | 1.35 | 1.77 |
| India | 18.1M | 24.6M | 26.7M | 19.5M | 31.9M | 44.7M | 1.08 | 1.30 | 1.67 |
| Brazil | 5.8M | 7.7M | 8.3M | 7.9M | 11.6M | 13.5M | 1.38 | 1.51 | 1.62 |
| United Kingdom | 4.3M | 5.2M | 5.6M | 5.8M | 7.7M | 10.5M | 1.37 | 1.48 | 1.88 |
| Indonesia | 3.8M | 4.9M | 5.3M | 3.9M | 6.5M | 6.9M | 1.02 | 1.33 | 1.31 |
| Nigeria | 1.2M | 1.7M | 1.8M | 1.4M | 2.3M | 3.0M | 1.14 | 1.39 | 1.66 |
| Pakistan | 1.6M | 2.3M | 2.5M | 1.7M | 2.9M | 3.5M | 1.09 | 1.26 | 1.41 |
| Vietnam | 2.1M | 2.8M | 3.0M | 3.5M | 5.3M | 5.1M | 1.71 | 1.92 | 1.73 |
| Mexico | 2.0M | 2.6M | 2.9M | 1.6M | 2.7M | 3.2M | 0.81 | 1.01 | 1.11 |
| World (ex-China) | 149.0M | 192.5M | 207.9M | 198.2M | 290.3M | 377.1M | 1.33 | 1.51 | 1.81 |
GitHub Innovation Graph, 2020–2026 Q1, ex-China. Developers and git pushes in millions; pushes/developer is pushes ÷ developers in the quarter. Q4 = Oct–Dec. Latest quarter (Q1’26) can still be revised.
3 · So why are both happening? The J-curve.
The two facts only look contradictory if you assume “more software” must mean “more developers at every firm.” It doesn’t. AI breaks the link between the amount of software and the number of people needed to produce a fixed slice of it.
So the curve has two lines, not one. Developers needed for the same work falls — that is the near-term dip, and it is why Microsoft, Block and Amazon are cutting. Total software work climbs — that is the +46%. For a while the dip wins and headcount demand contracts, hitting juniors first. Then total work, growing faster than per-unit labour keeps falling, pulls the number of people needed back up — but into different work. Down, then up. A J.
The consultancies, read carefully, say the same thing in aggregate. BCG (2026) projects 50–55% of US jobs will be reshaped rather than replaced, and classifies software engineering as an amplified role. The WEF Future of Jobs 2025 projects 170M jobs created against 92M displaced by 2030 — net +78M, with software developers among the fastest-growing roles. Gartner expects 90% of enterprise software engineers to use AI code assistants by 2028 (up from under 14% in early 2024). McKinsey puts up to 30% of US work-hours as automatable by 2030 — hours, note, not jobs.
4 · The different work on the right arm of the J
If developers are needed again by 2030, they will not be doing what they do today. The tools write more of the code; what rises in value is everything around the code — and it maps almost exactly onto what AI is worst at:
- Figuring out what to build. Synthesising messy requirements and user stories out of ambiguous intent — the judgement AI can assist but not own.
- Talking to real users. Interviewing, observing, understanding context — work that lives in human interaction, not token prediction.
- Designing things that actually work. UX and interfaces people can use, which still turns on taste and testing.
- Making it robust at scale. Turning a plausible draft into code that holds up in production — architecture, systems thinking, performance, failure modes.
- Orchestrating and verifying AI. Directing agents, reviewing their output, catching the confident mistakes. Gartner calls this the shift to orchestration and oversight; Deloitte, the human-in-the-loop on AI output.
This is the part the layoff headlines miss. AI doesn’t remove this work — it raises the bar on it, and it raises the leverage of the people who are good at it. The 2030 developer looks less like a code-typist and more like a product-minded systems thinker with a fleet of agents.
And the shift is being funded
The move to that work isn’t just hope — companies are starting to pay for it. In the WEF’s 2025 survey of over a thousand employers, 85% plan to prioritise upskilling and 77% intend to reskill workers to work alongside AI by 2030. The money is beginning to show up: Accenture reported $1 billion of learning spend in FY2025 (training hours up 9% year over year), with 550,000+ employees through GenAI fundamentals — and GenAI course enrolments on Coursera jumped 195% to more than 8 million. The reskilling the right arm of the curve depends on is already being financed.
Be honest about the gap, though: most of the survey numbers are intent, not audited spend; Accenture doesn’t break out how much of its billion was GenAI-specific; and average formal training hours per employee actually fell last year even as learning budgets rose. The commitment is real. Whether it keeps pace with how fast the work is changing is the open question — and the thing worth watching.
5 · The honest part
We are not going to tell you the rebound is guaranteed. The honest reading of the evidence has real tension in it:
- No one has proven a software-specific J-curve. WEF’s net-positive number spans all occupations and macrotrends; PwC’s growth figure is a historical association, not causation; BCG’s numbers are modelled scenarios. The dip is measured; the height and timing of the rebound are not.
- “It all comes back” is unsupported. Block’s ~40% cut and Amazon’s explicit guidance toward a permanently smaller corporate workforce are real evidence that some firms will not round-trip.
- The entry-level rung is the clear casualty. Stanford’s 13% early-career decline is the one hard, specific signal — and if juniors can’t get in, the senior pipeline breaks later.
The counter-evidence that keeps us optimistic is specific, not hand-wavy. IBM automated large chunks of back-office work with AI — and still grew total headcount, because it reinvested the savings into engineers and sales. Klarna cut customer service hard on AI, decided it had overshot on quality, and began hiring humans back. Overshoot and correction — a point-in-time reallocation, not a one-way staircase down.
6 · The leader’s verdict
Three things to carry into a planning conversation:
- Don’t mistake the dip for the destination. The cut-now moves are the left arm of the curve. Plan for the right arm — more work, different work — or you’ll be caught short of the exact skills that become scarce.
- Measure output, not headcount. The firms winning this are the ones whose software output is rising while their team shape changes. Track what you ship, not who you cut.
- Protect the bottom rung. The entry-level squeeze is the one unambiguous risk. The organisations that keep training juniors — on the new, AI-orchestration-shaped work — will own the talent the rebound demands.
The developer headcount is dipping. The developer’s work is not shrinking — it is growing, and moving up the stack. Fewer, then far more.
Sources: GitHub Innovation Graph (developer & git-push counts by economy, 2020–2026 Q1; our own aggregation, ex-China); WEF Future of Jobs 2025; BCG, “AI Will Reshape More Jobs Than It Replaces” (2026); McKinsey Global Institute; Gartner; Stanford Digital Economy Lab, “Canaries in the Coal Mine” (2025); PwC AI Jobs Barometer 2025; Accenture 360° Value / talent reporting (FY2025); Coursera Global Skills Report 2025; Amazon (Jassy memo); company announcements (Microsoft, Block, Salesforce) via Reuters/AP. Projections are modelled scenarios, not forecasts; the latest Innovation Graph quarter can be revised. See also our Demand Paradox.