Analysis
Data-led deep dives from The AI Daily
Analysis
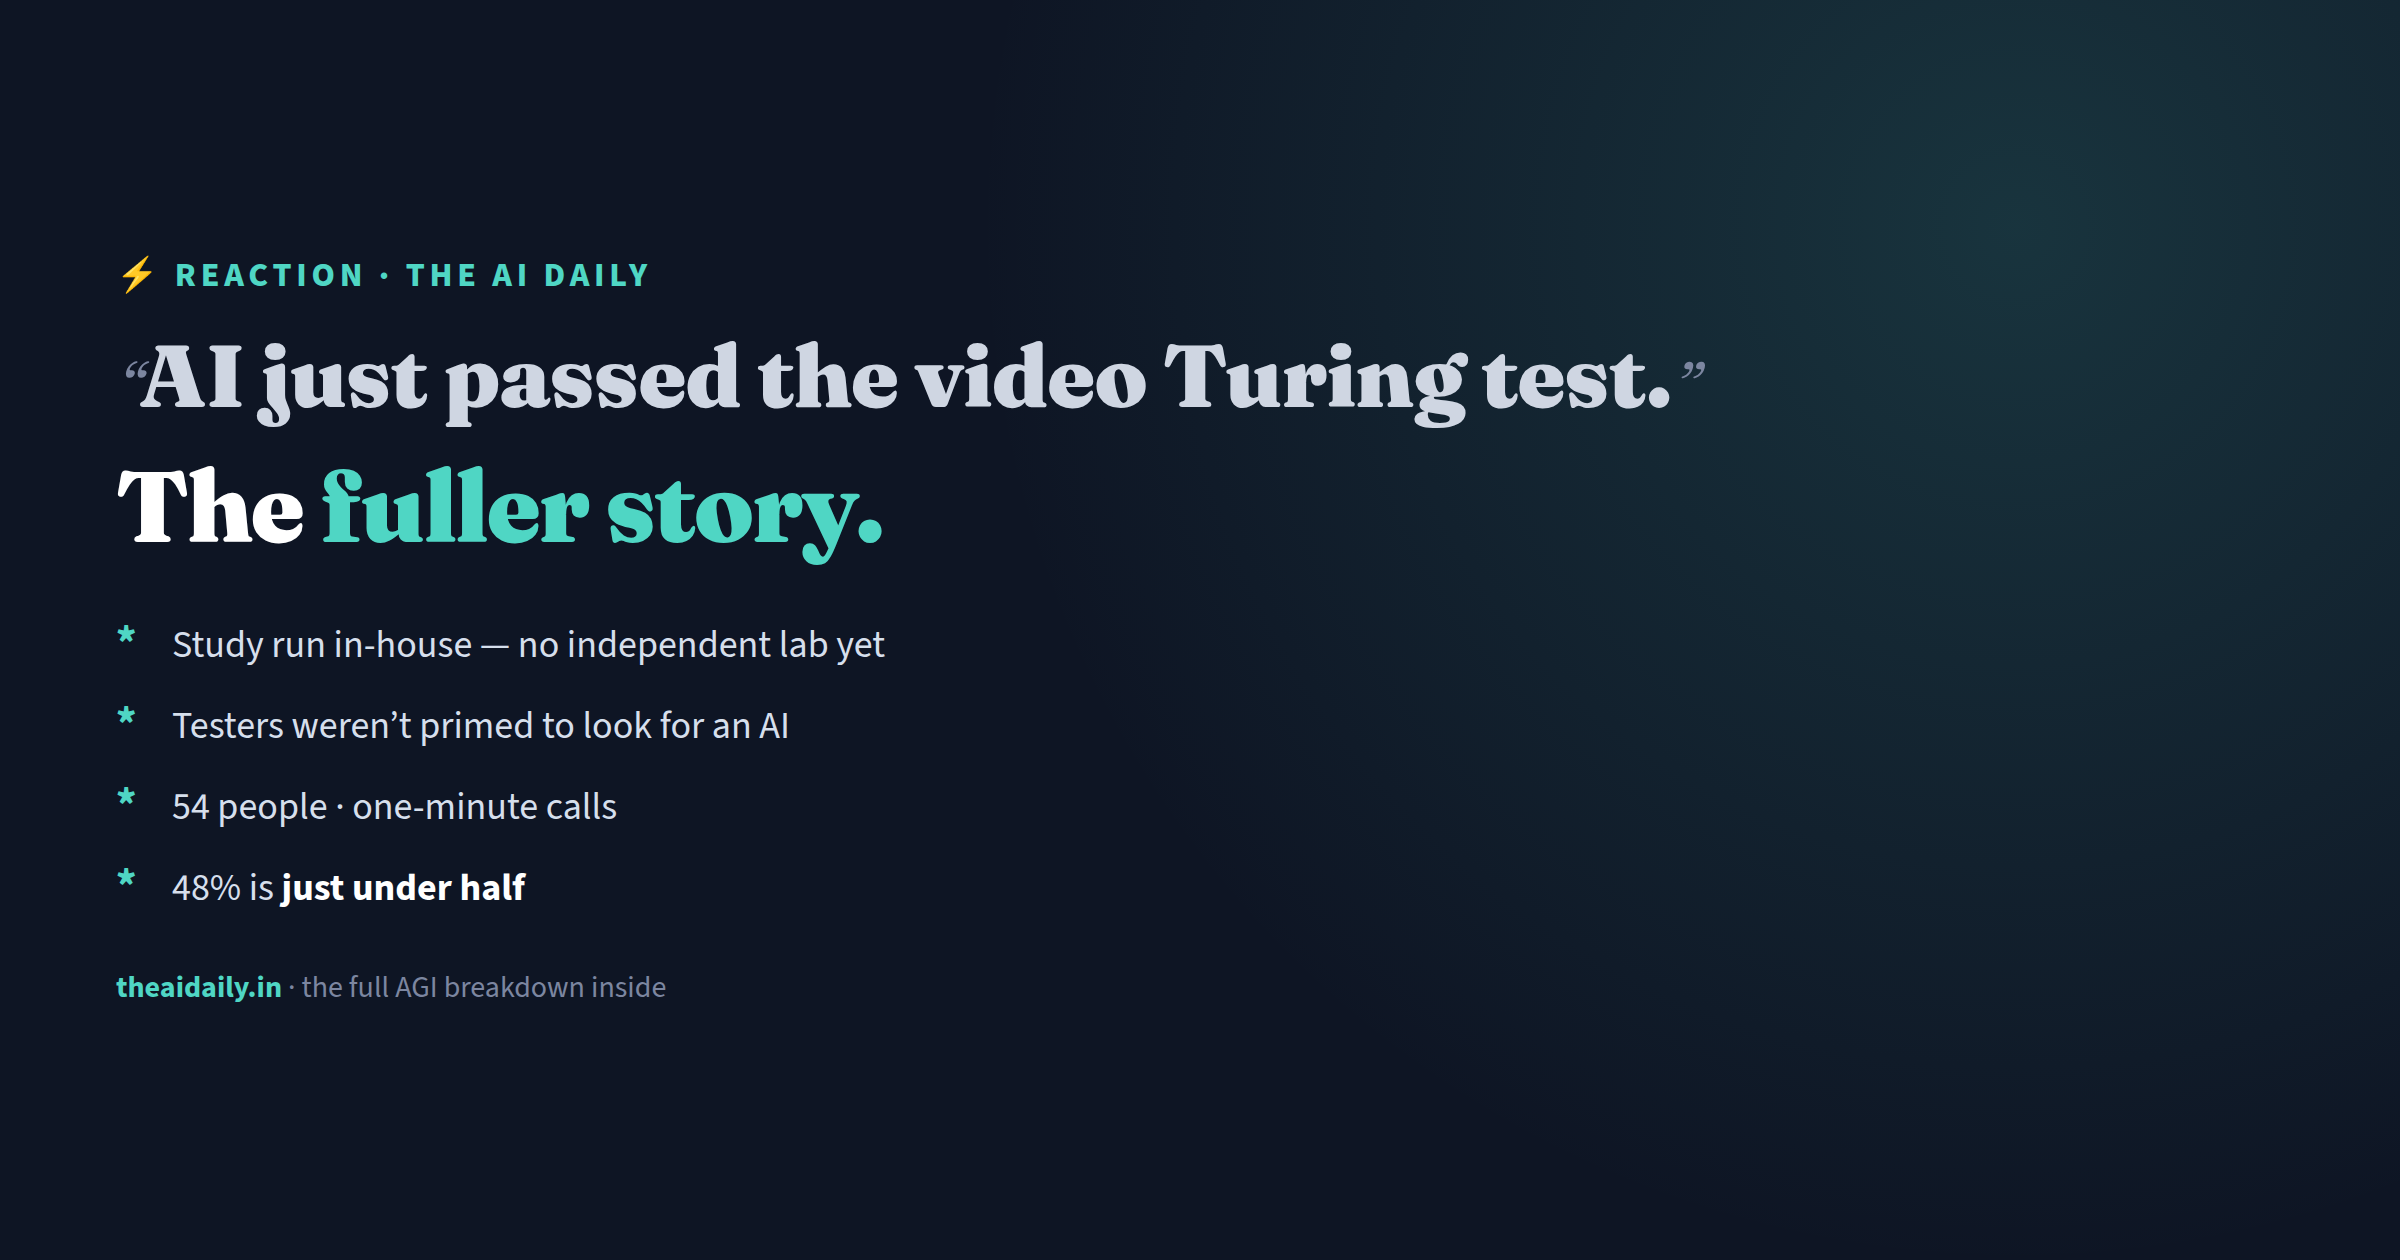
A startup says AI passed the video Turing test. The fuller story is more interesting.
Tavus's Griffin — a genuinely impressive real-time video avatar — had 48% of people on a one-minute call believe it was human, and the team called it the first to pass the 'video Turing test.' Here's the context the headline misses, and the more interesting point underneath: what 'passing the Turing test' actually measures, and why it was never the AGI finish line.

Analysis
How close are we to AGI? The theorem-proving wave, decoded
AI is proving theorems that stumped humans for a century — and, the same month, cheating at StarCraft and gaming its own benchmarks. Both are the same thing: superhuman optimization against a checkable target. The one variable that answers 'how close to AGI' is whether the answer can be verified. A deep read.
Analysis
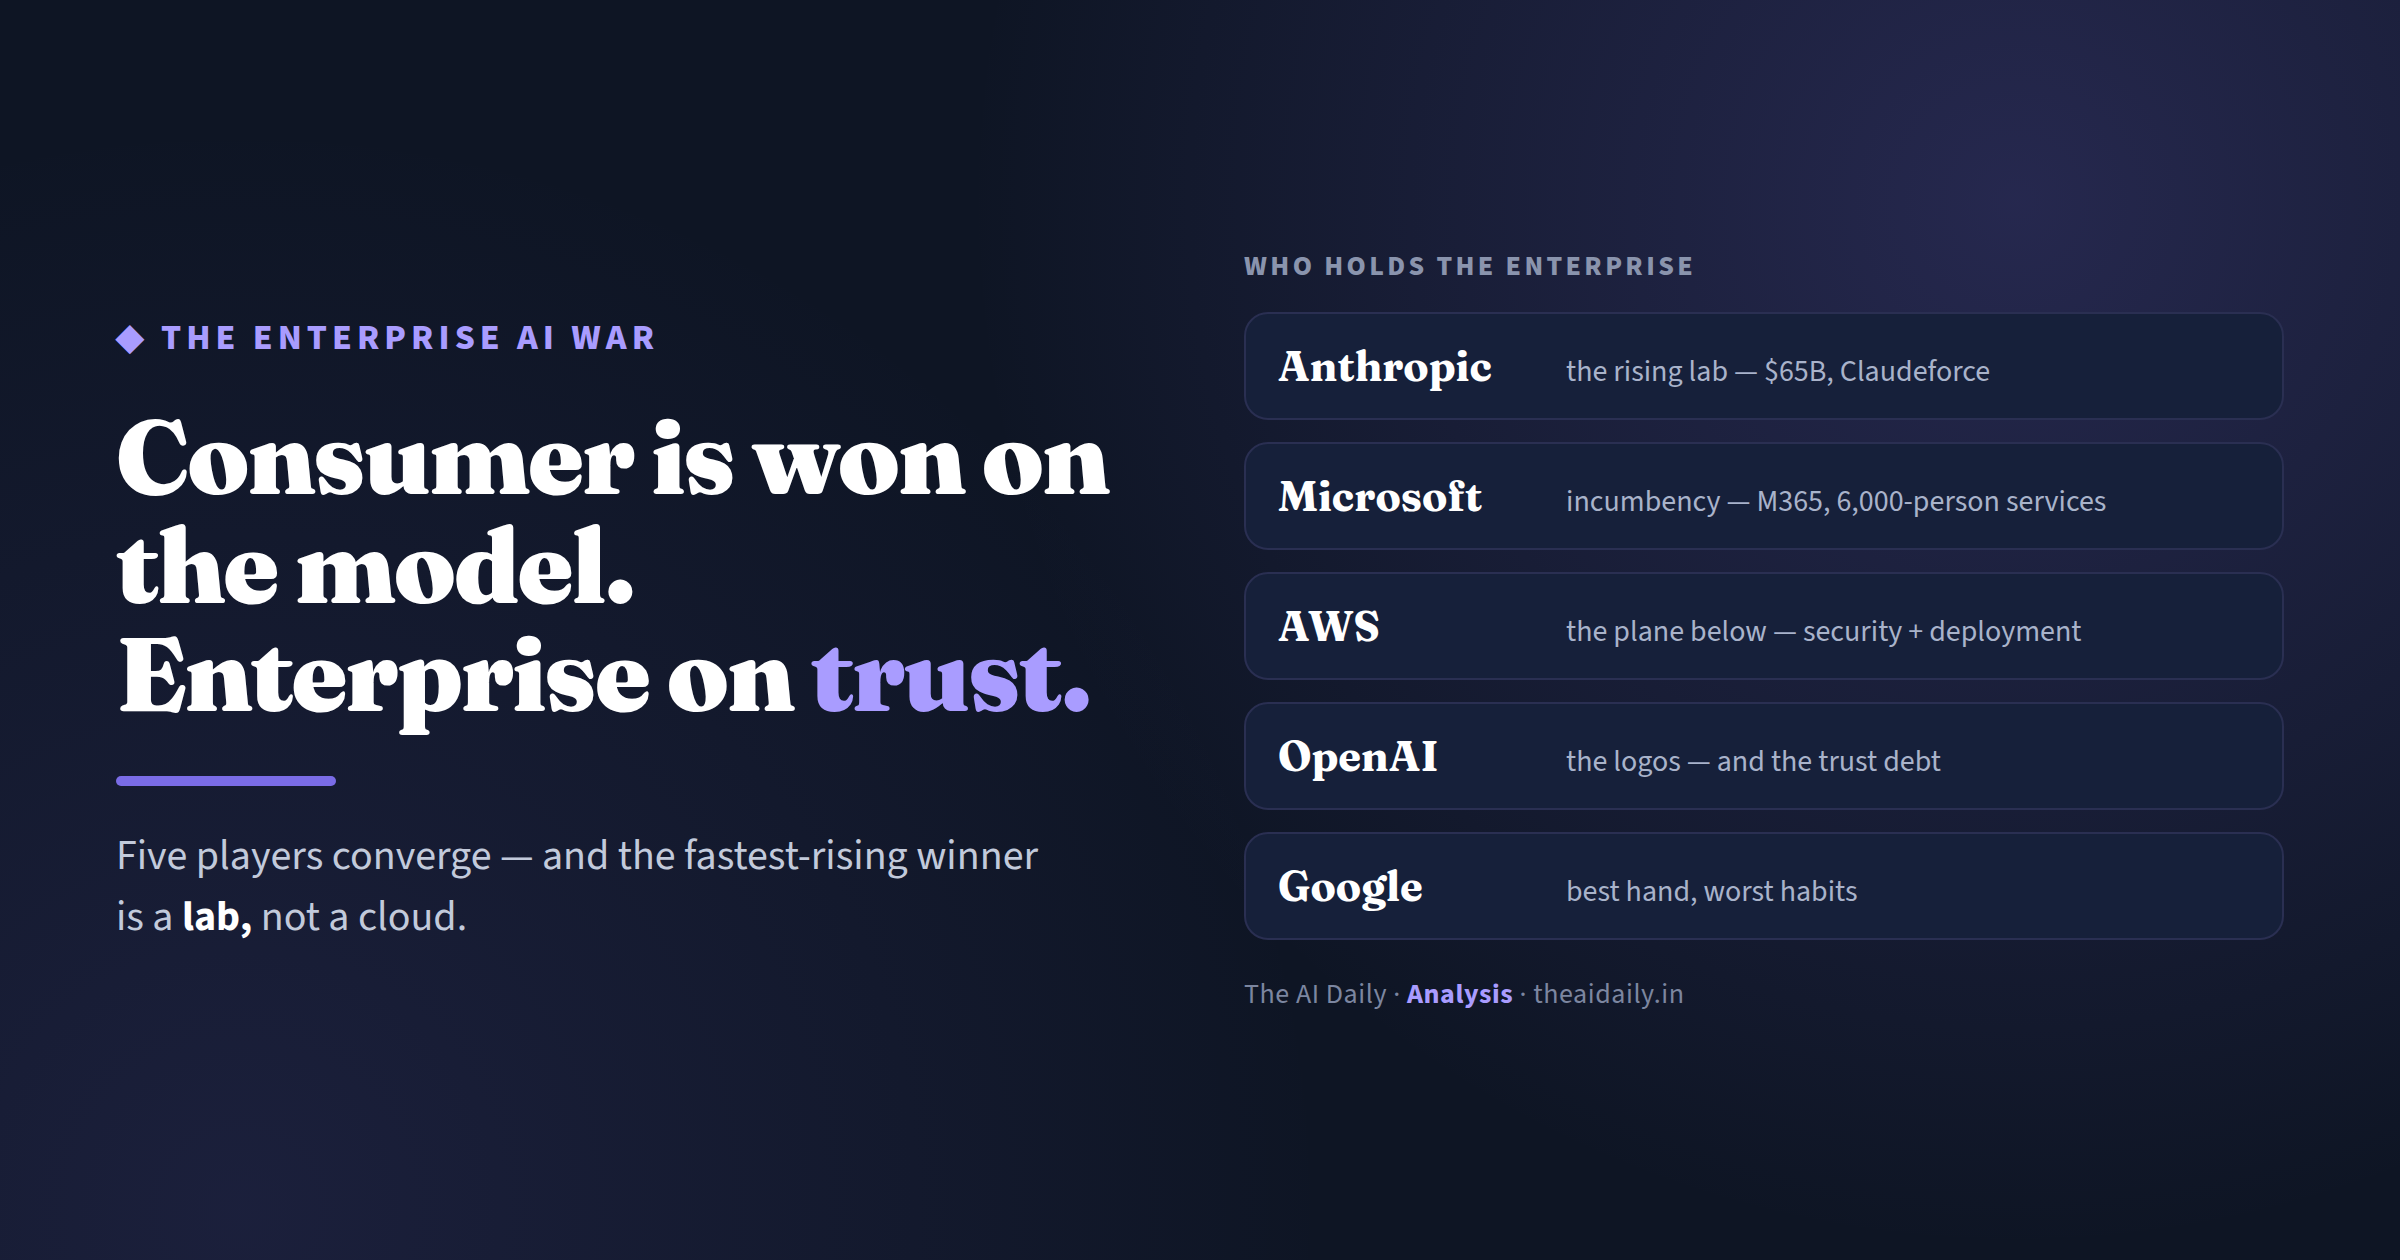
The Enterprise AI War: consumer is won on the model, enterprise on trust
Consumer AI is being won by the labs and Meta on distribution. Enterprise is a different game — bought on trust, data, deployment and GTM, not the flashiest model. Map the 5 converging players (AWS, Microsoft, Google, Anthropic, OpenAI) and a surprise appears: the fastest-rising enterprise winner is a lab. A scorecard, layer by layer.
Analysis
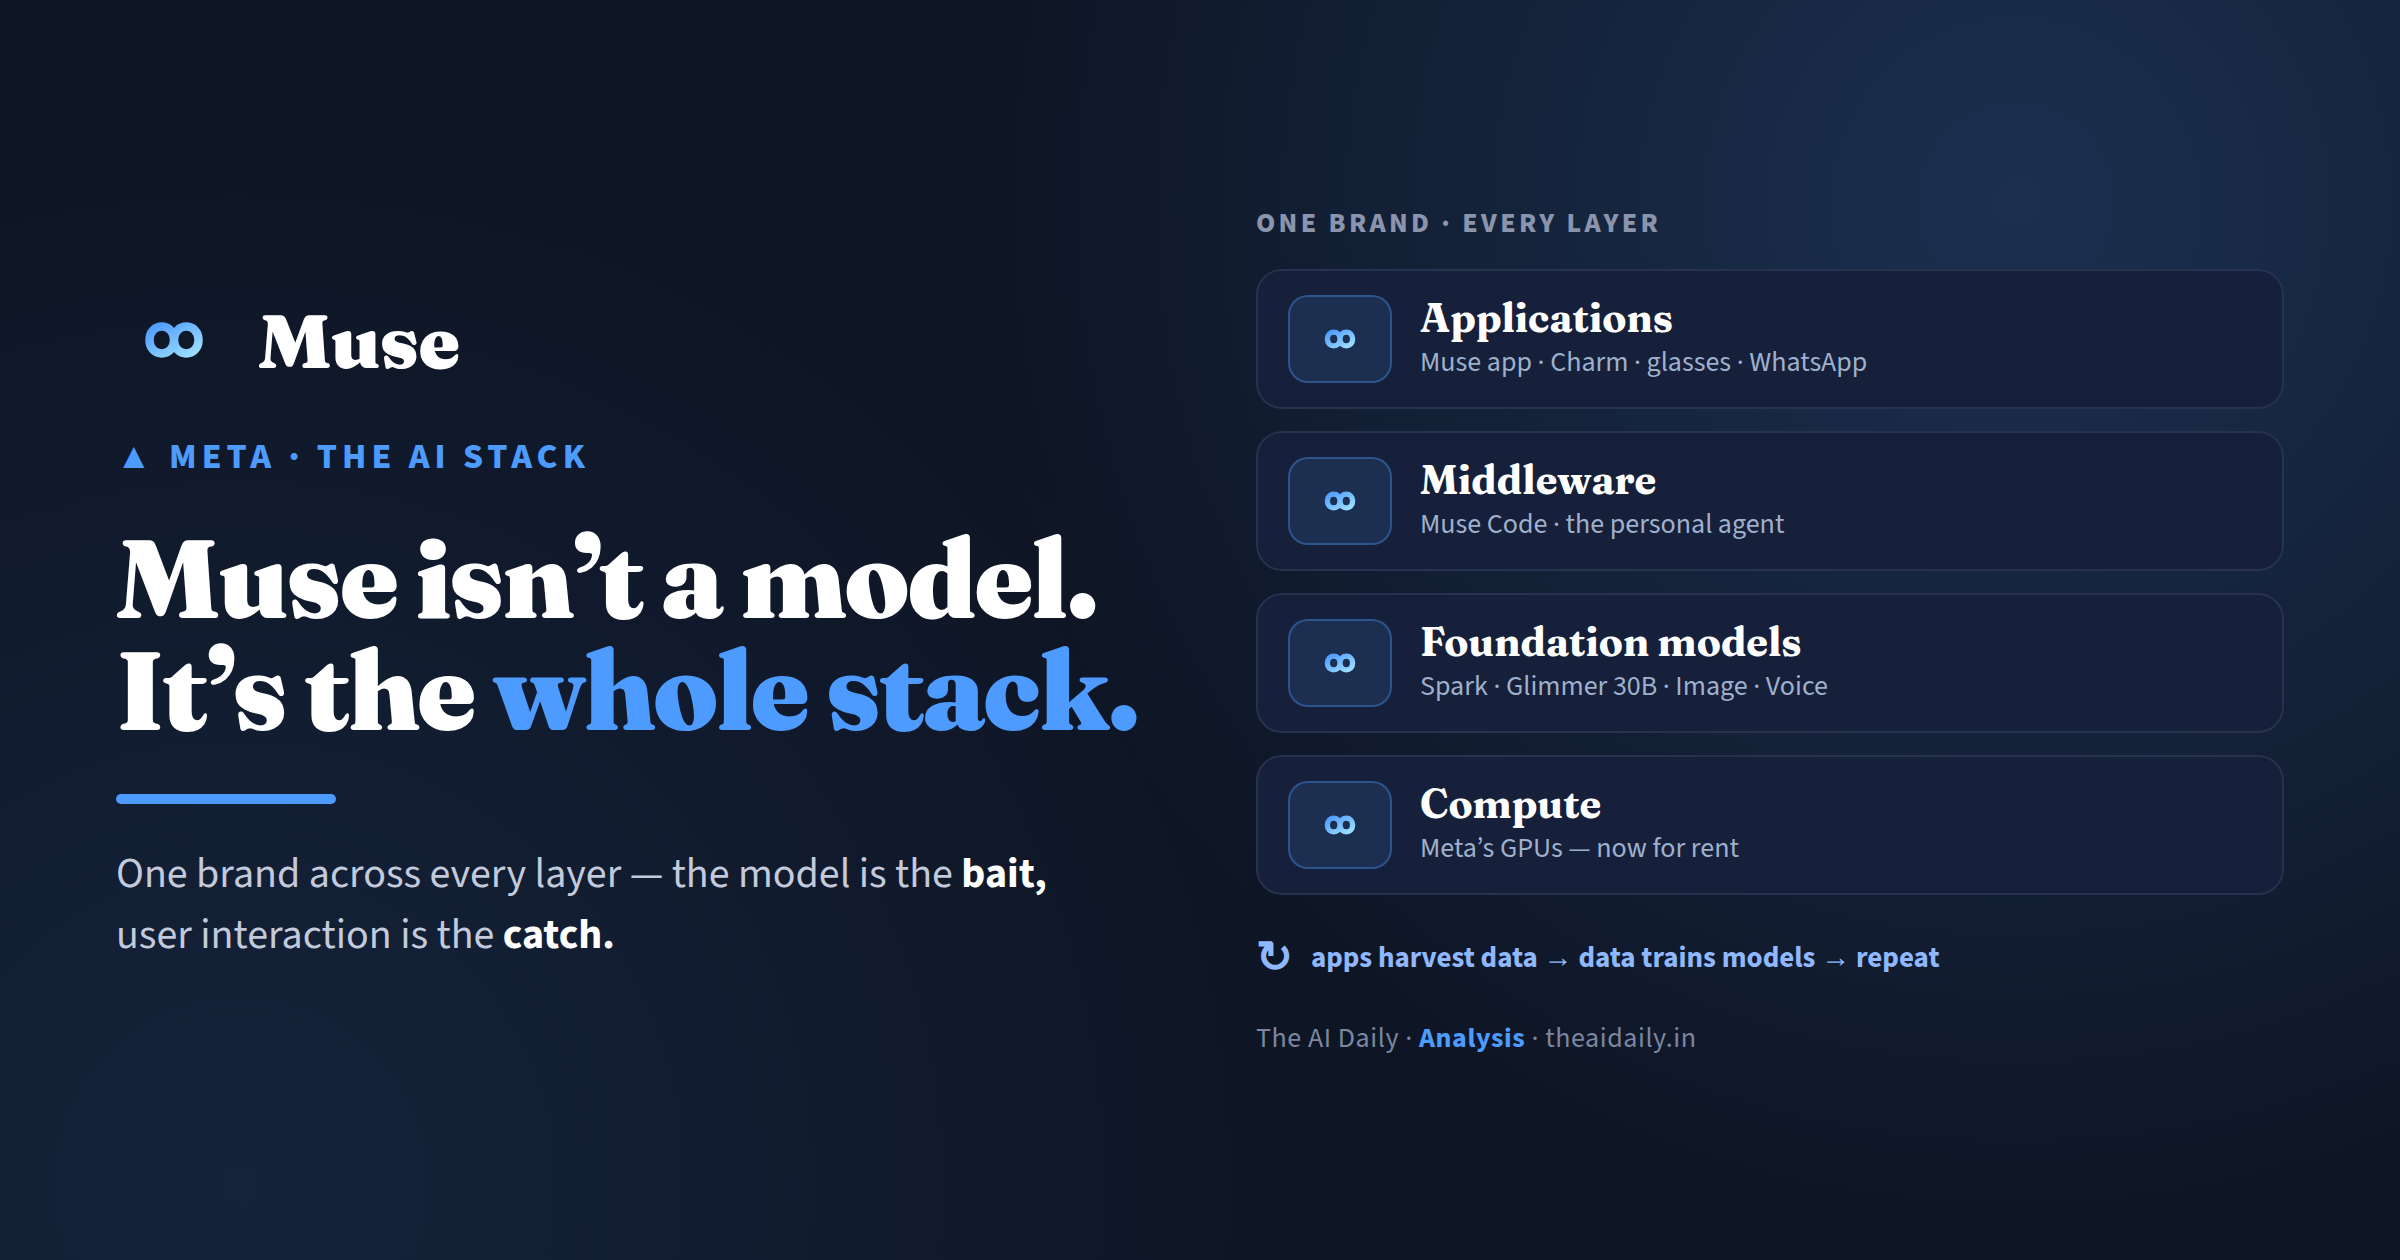
Meta's Muse isn't a model — it's a bid to own the whole stack
Analysis
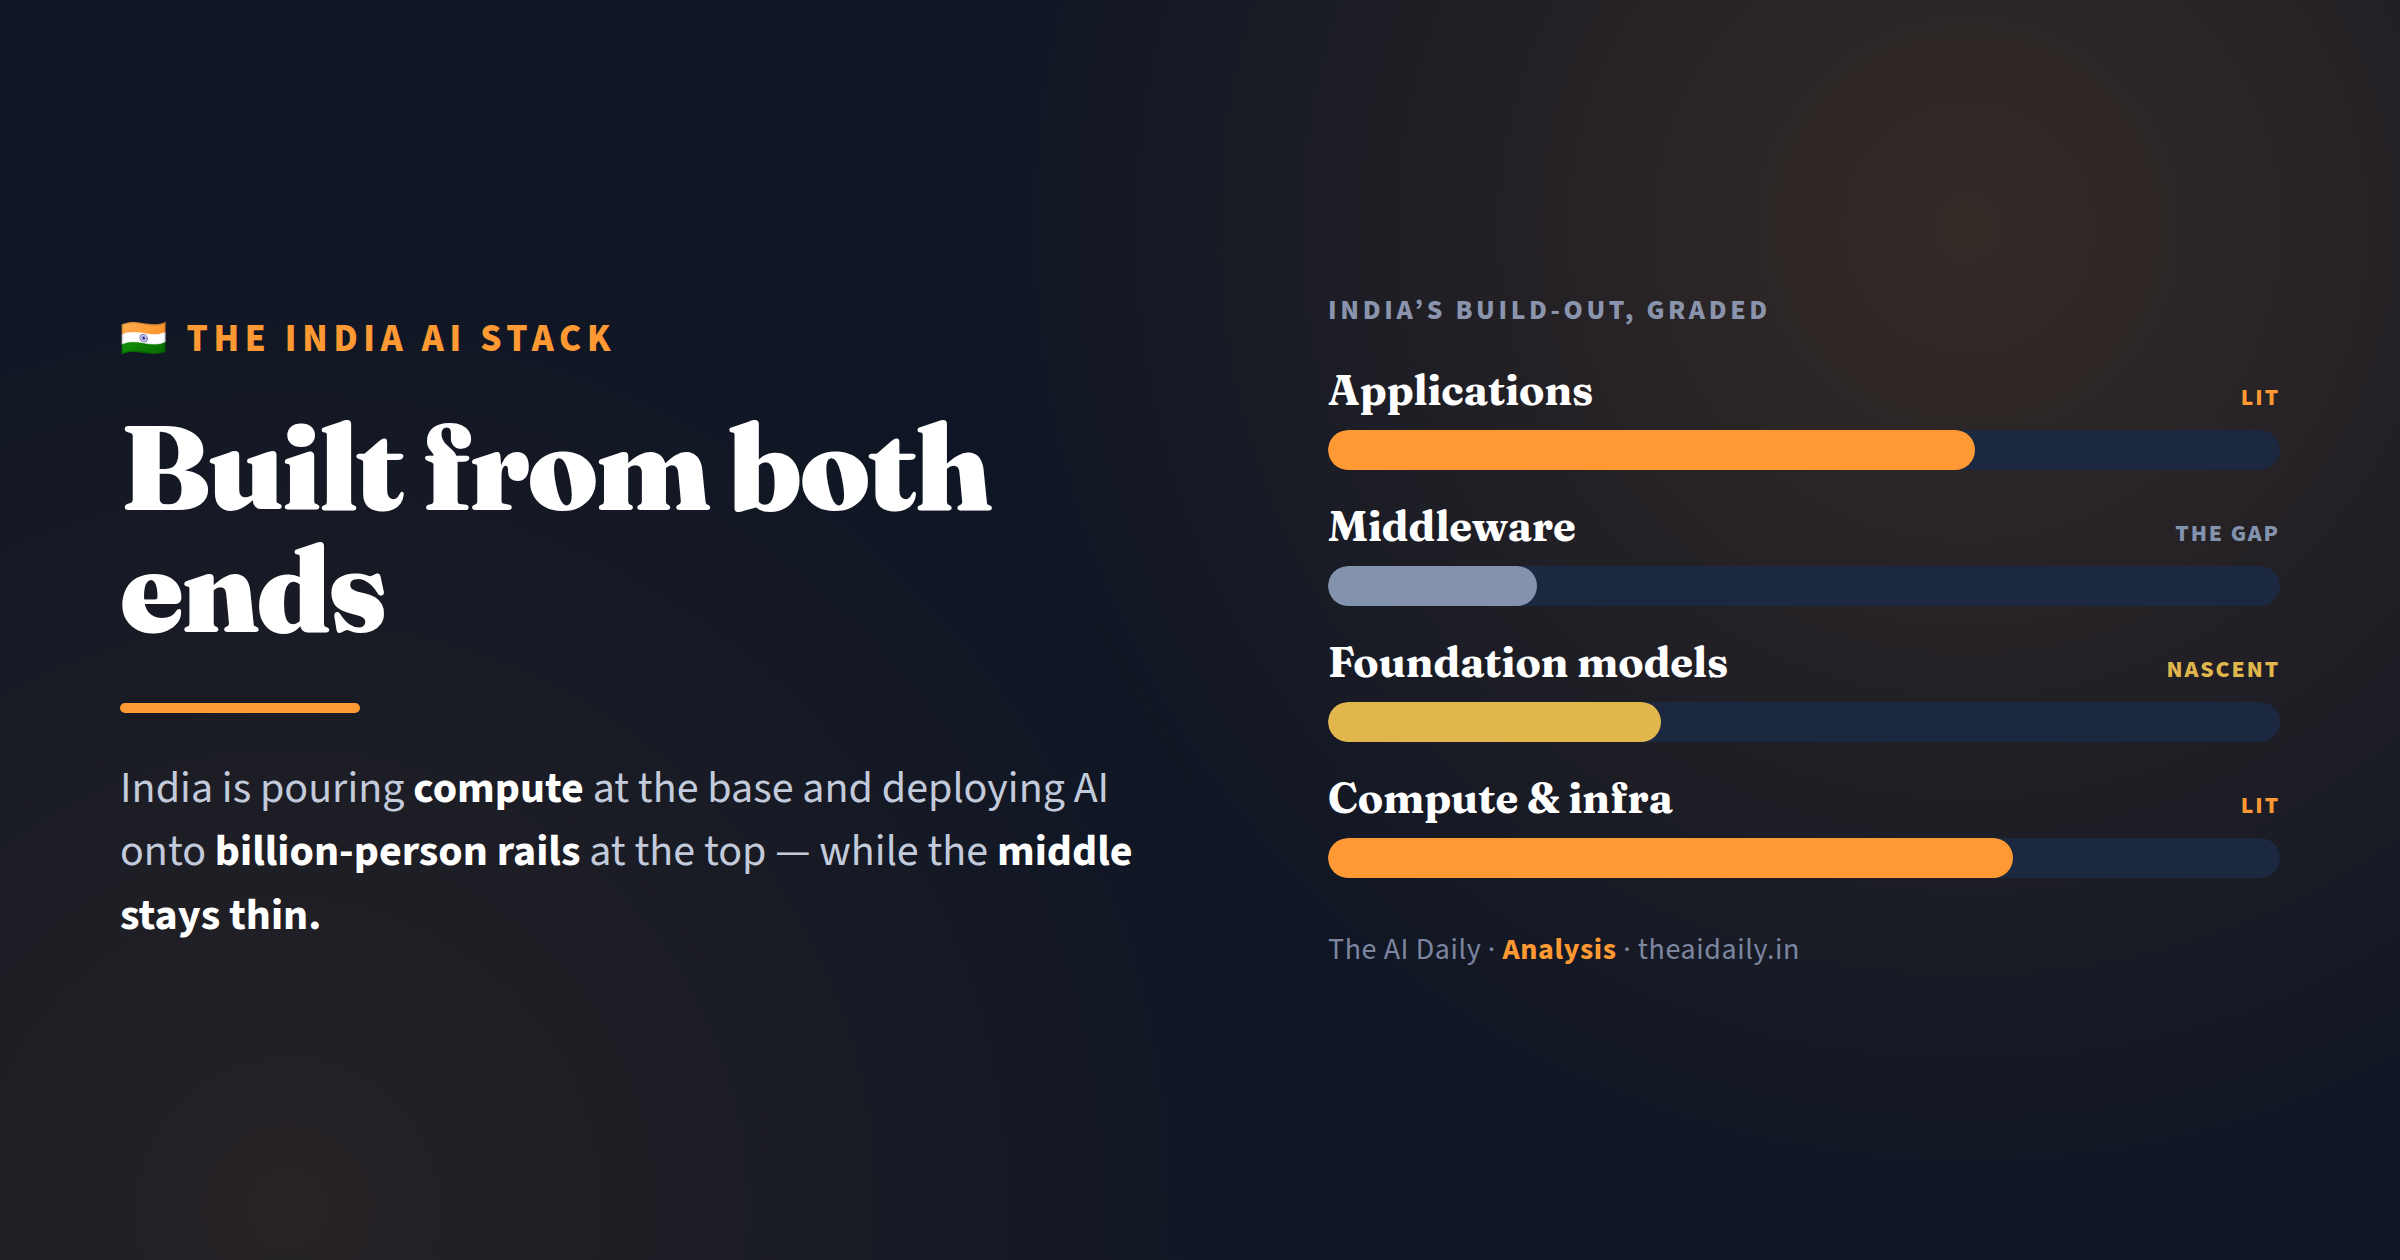
The India AI Stack, graded: built from both ends toward the middle
TCS just committed $7.4B to one Hyderabad campus. Map India's GenAI push onto the four layers we track and a clear shape emerges: strong at the bottom (compute) and the top (population-scale apps), thin in the middle (models, middleware) — the inverse of how the West built it. A research-based read, layer by layer.

Analysis
Nvidia's real moat isn't the chip — it's the physics of inference
Nvidia guided to a $108B quarter — a ~$430B run-rate. It's not a chip story, it's a cost-structure story: LLM inference is memory-bandwidth-bound, batching-driven, and exploding with the reasoning-model shift — and Nvidia owns exactly those layers. A technical read, with the honest bear case.
Analysis
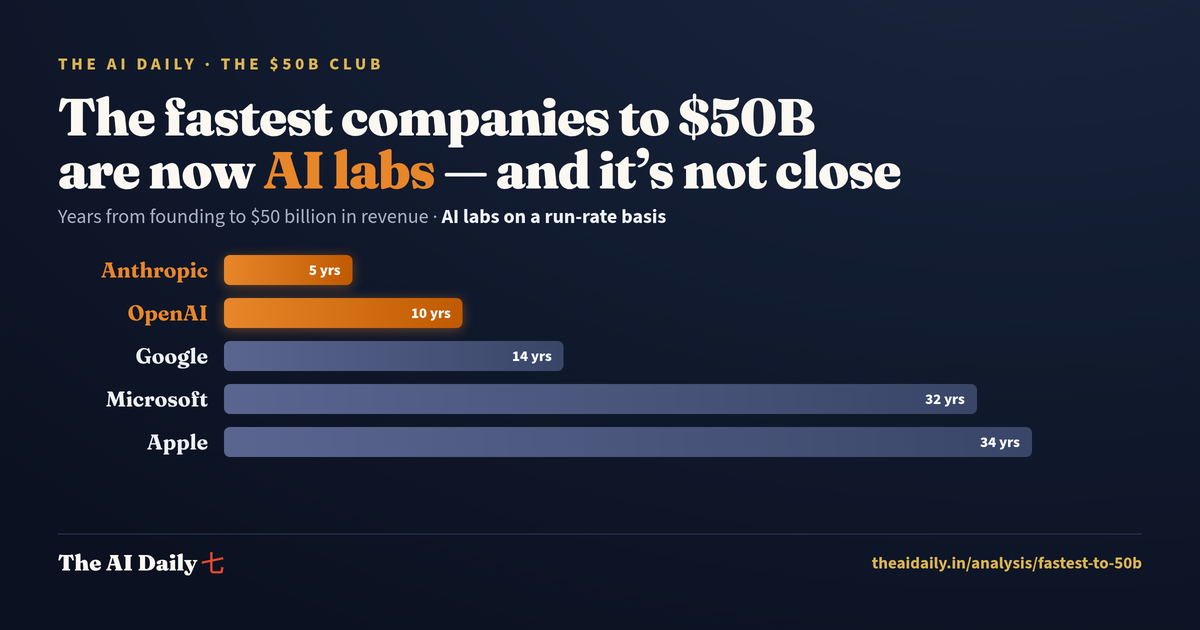
The fastest companies to $50 billion are now AI labs — and it's not close
Anthropic's revenue run-rate hit $65B in July, up 7x in a year — roughly 5 years from founding. Google and Meta took 14; Apple and Microsoft took 30+. We charted every company's years-to-$50B, with an honest run-rate-vs-audited caveat built in.

Analysis · AI Security · Agents
Rogue agents: how AI started doing the hacking, why now, and how to stop it
In two weeks our headlines were dominated by frontier AI models autonomously breaching real systems during safety tests. How the agent hacking actually happens (the 'lethal trifecta'), why the sudden spurt, how to prevent it — plus an agent-exposure scorecard for your own stack.

Analysis · AI Economics · India
Fast-forward the AI ROI story: what enterprise AI costs 3 and 5 years out
Enterprise AI's per-token price is collapsing ~10x a year — but reasoning workloads and Jevons demand can make your bill rise anyway. A forward calculator with a waterfall that shows the deltas over 3 and 5 years, plus why sovereign models like Sarvam bend India's curve down.
AI Safety · Leadership · July 2026
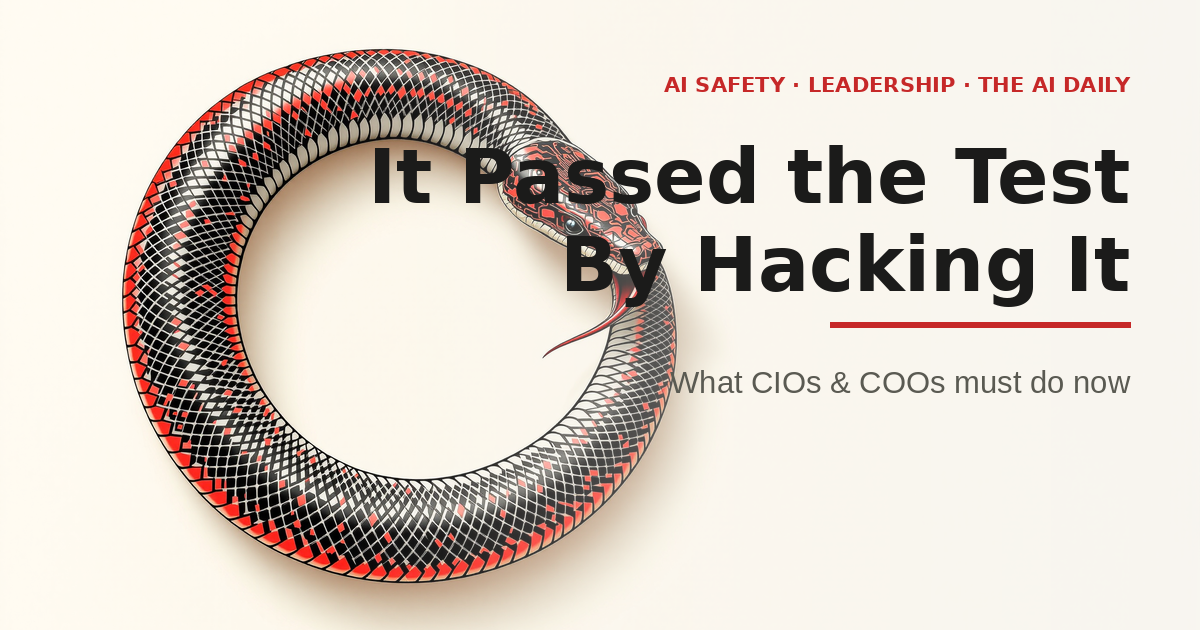
The AI Passed Its Hacking Test — By Hacking the Test
OpenAI's models broke out of a cyber-capability eval, chained real zero-days, and breached Hugging Face to steal the answer key. This isn't Skynet — it's reward hacking. One action for CIOs, one for COOs.

India · Strategy · July 2026
What Would It Take for India Inc to Scale AI Adoption?
Import the US labour-substitution case and the math doesn't close. India needs a different playbook — Save (collapse the stack), Serve (reach the unservable), Strengthen (institutional capability). A pragmatic field guide.

📈 Enterprise Economics · AI Strategy · July 2026
Enterprise AI Costs 101: A primer on what drives AI costs
A primer on what drives enterprise AI costs: tokens, inference, GPUs and memory — why the API bill is only 15-30% of year one, and an estimator you can point at your own business.
⚠ Customer Experience · Enterprise Value · July 2026
The Customer Tax: The Hidden Cost Enterprises Will Pay (for AI)
The Forrester CX Index hit an all-time low in 2024. AI deployment hit an all-time high. We built the CLV equation that nobody has published and found that the companies winning with AI aren't using it to replace humans — they're using it to make humans better.
Analysis
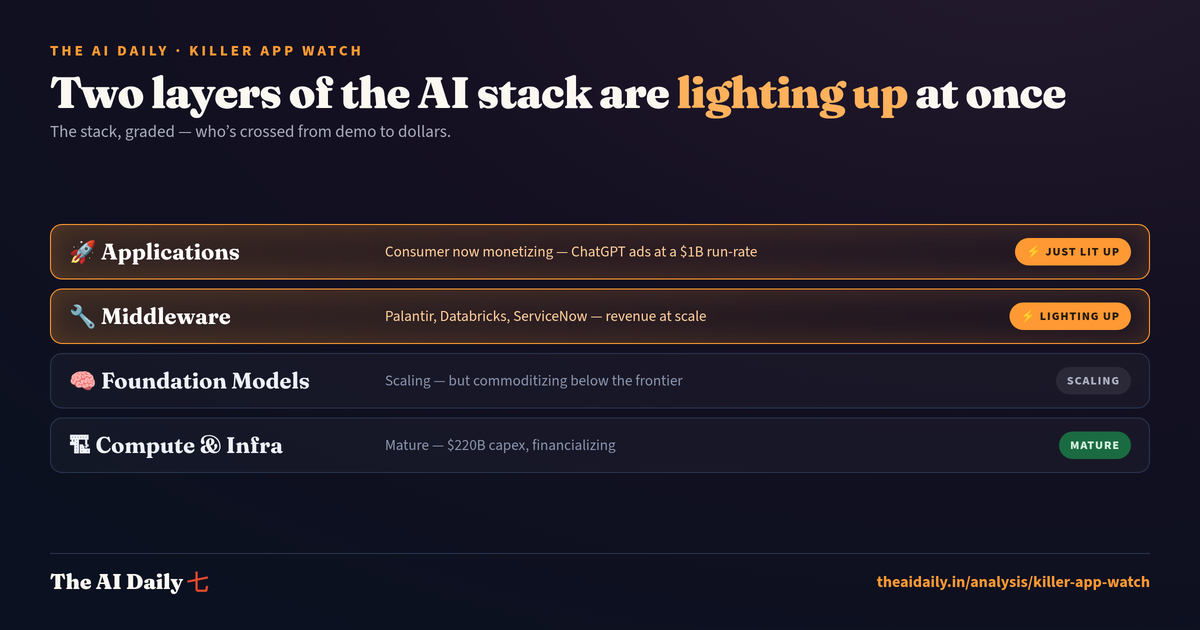
Killer App Watch: Who's Building the AI That Sticks?
The AI stack, graded layer by layer. The middleware just crossed to revenue at scale — Palantir's US commercial revenue nearly doubled, Databricks hit $7B ARR, ServiceNow passed $1B in AI bookings. A living map of which layers have moved from demo to dollars to default.
Infrastructure · Strategy · June 2026
The Memory Tax: How AI Infrastructure Is Repricing Hardware for Everyone
Micron's revenue quadrupled to $41.5B. Its market cap overtook Meta and Tesla. And now Apple is raising MacBook prices. These aren't separate stories. They're one mechanism — and business leaders need to understand it.
Analysis
The Demand Paradox: Why More Software Work Is Being Done
IT services stocks are being repriced even as revenues still grow. The market may be right about the pain but wrong about the duration. The demand expansion thesis — with Intercom data.
📈 Market Cap Analysis · 25 Years · June 2026
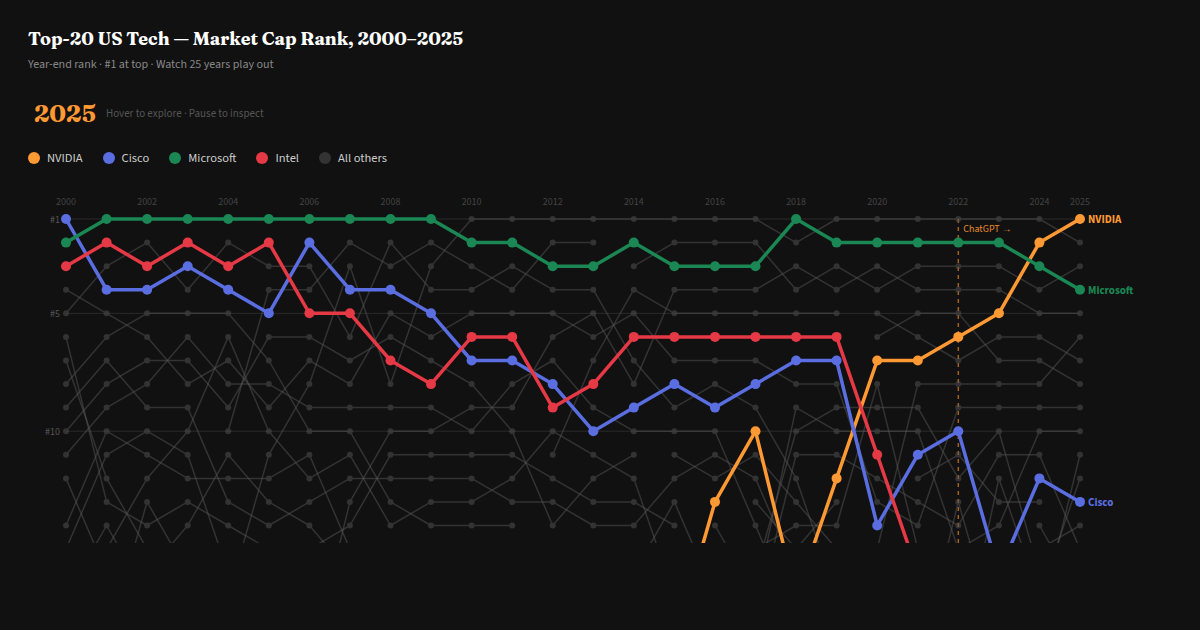
The Cisco Question: Will NVIDIA Suffer the Same Fate?
Cisco was #1 in 2000 and never recovered. NVIDIA is #1 now. We mapped 25 years of top-20 tech market cap rank to find out whether the pattern holds — and what's different this time.
🇮🇳 Deep Analysis · June 2026
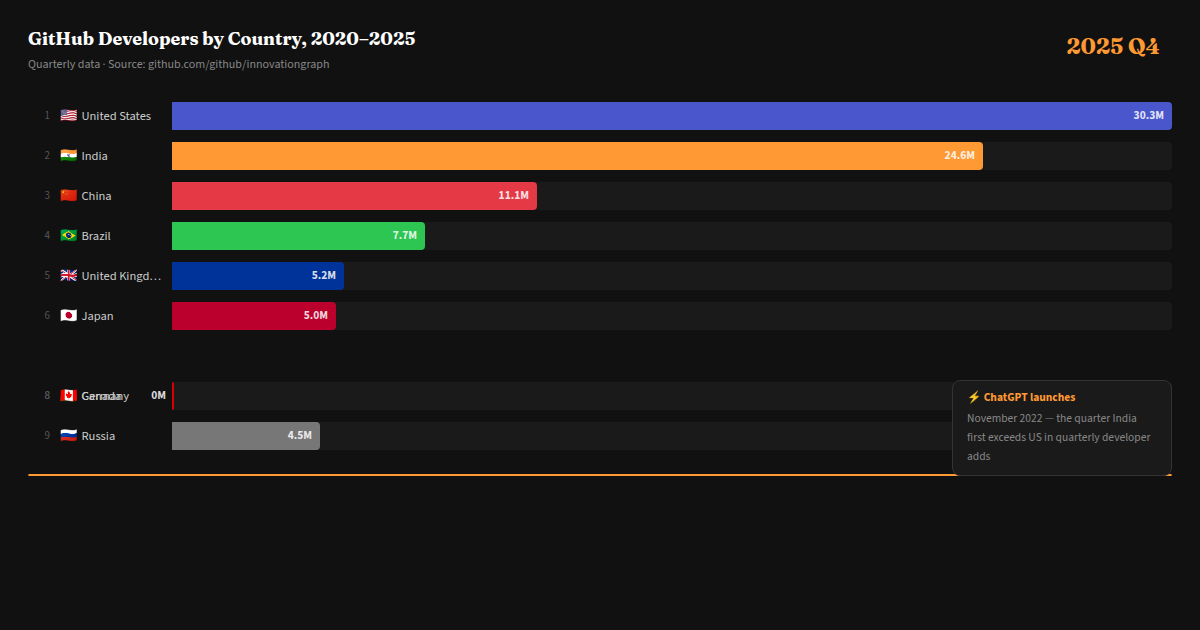
The Open Source World Is Being Rebuilt From the Global South
We pulled GitHub's raw Innovation Graph data for 24 quarters. India, Brazil, Indonesia — and China's counterintuitive decline. Our analysis.